
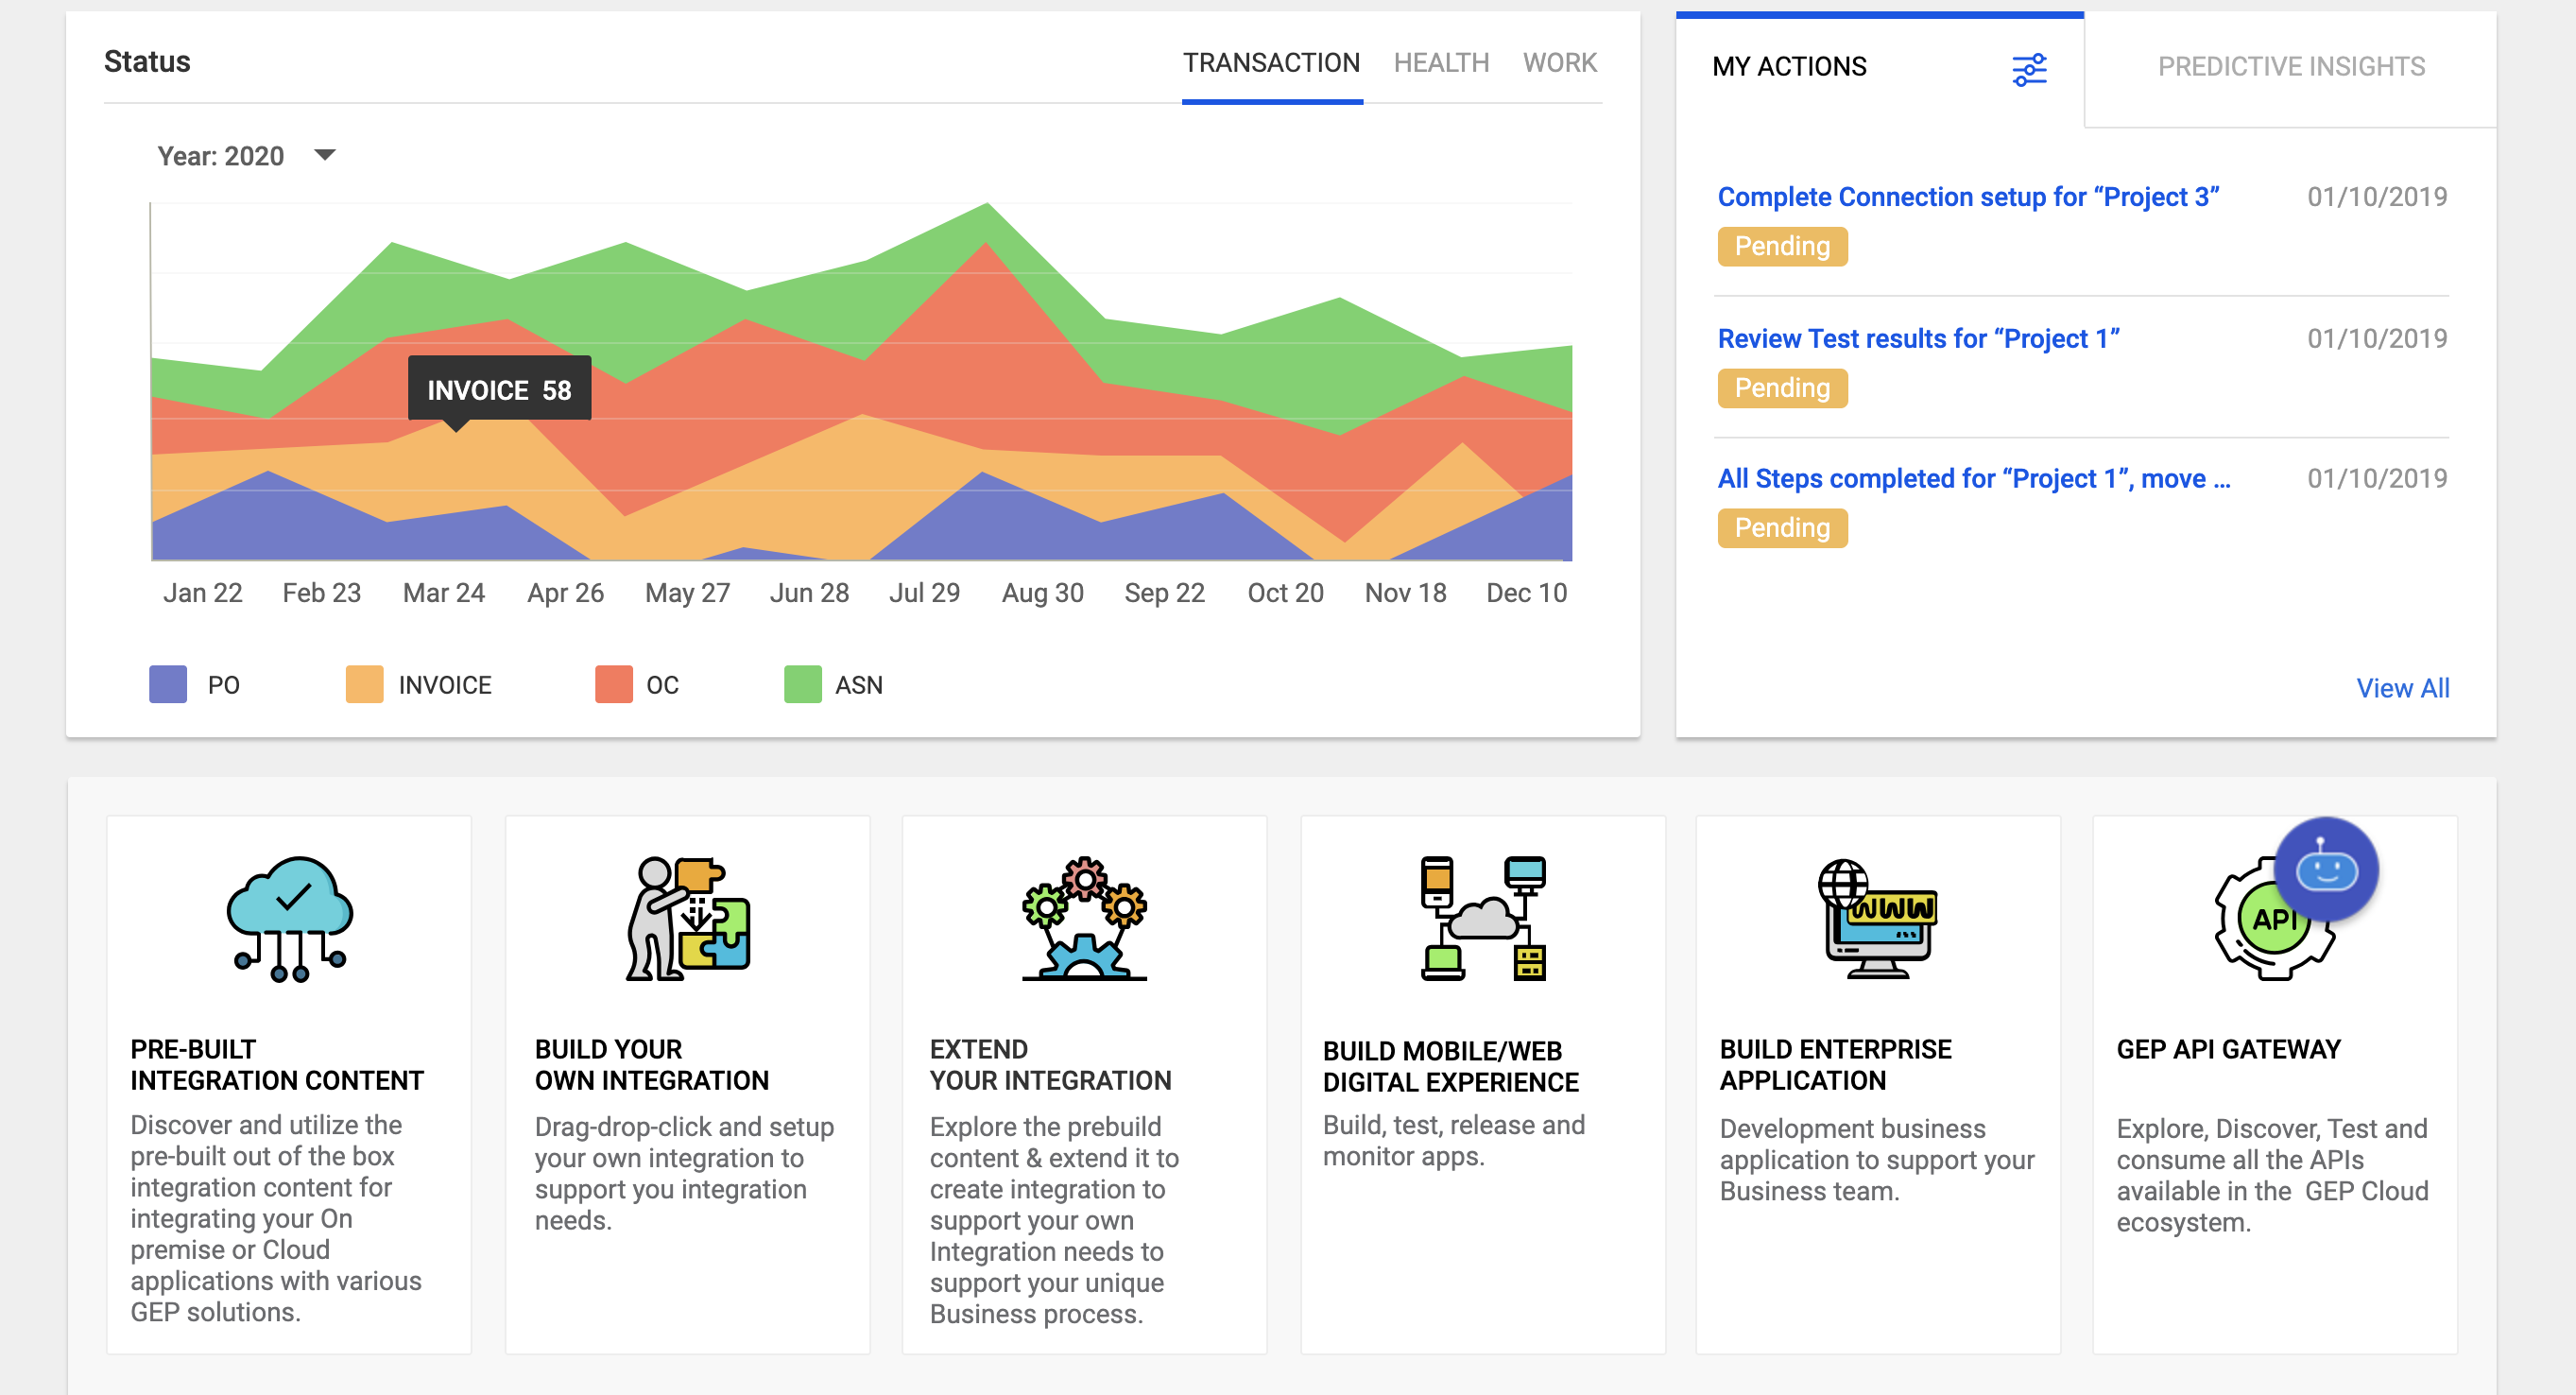
API Gateway Analytics
Centralized, actionable analytics dashboard for monitoring API performance, deployments, and usage trends.
Project Overview
I designed a comprehensive integration platform that enables large enterprises to seamlessly connect their existing ERP systems (especially SAP) with a modern unified Source-to-Pay procurement solution. The goal was to simplify complex system integrations, automate data synchronization between master and transactional records, and reduce the time and technical effort required to go live. The final product is an intuitive, wizard-style interface that guides users through connectivity setup, configuration, testing, and deployment — making enterprise-grade integration accessible to both technical and business users.
My Role in the Project
As the lead UX Designer, I owned the end-to-end user experience for this integration module. I conducted user research, created information architecture, designed all screens and interaction flows, built the high-fidelity Axure prototype, and collaborated closely with product managers, developers, and solution architects. I also facilitated design reviews and iterated rapidly based on stakeholder and user feedback.
Challenges Encountered
Presenting highly technical processes (data gateways, authentication, field mapping) in a simple and non-intimidating way.
Managing a large number of configurable elements (master data, transactional flows, lookups) without overwhelming the interface.
Ensuring the flow felt guided and progressive while still giving advanced users flexibility and control.
Designing for error handling and troubleshooting scenarios that could easily frustrate users during real implementations.
User Research Approach & Insights
I conducted stakeholder interviews with solution architects, SAP consultants, and procurement operations leads, along with usability testing sessions involving both novice and experienced users. The research revealed that users strongly preferred a clear, step-by-step wizard experience over a flexible but overwhelming open interface. They emphasized the need for visual progress indicators and prominent success/error statuses to build confidence throughout the process. Real-time feedback during configuration, particularly for data mapping and testing, emerged as a critical requirement. Additionally, while users appreciated smooth “happy paths,” they needed robust support for handling exceptions, errors, and easy rollback options.
Ideation Process
I started with detailed user flows and low-fidelity wireframes to map the entire integration journey. I explored multiple approaches — from a completely linear wizard to a dashboard-driven experience — and tested them with the team. I used collaborative whiteboarding sessions to prioritize features and created several design variations for the configuration and testing screens. The final direction focused on clarity, progressive disclosure, and visual reassurance at every step.
The Solution Implemented
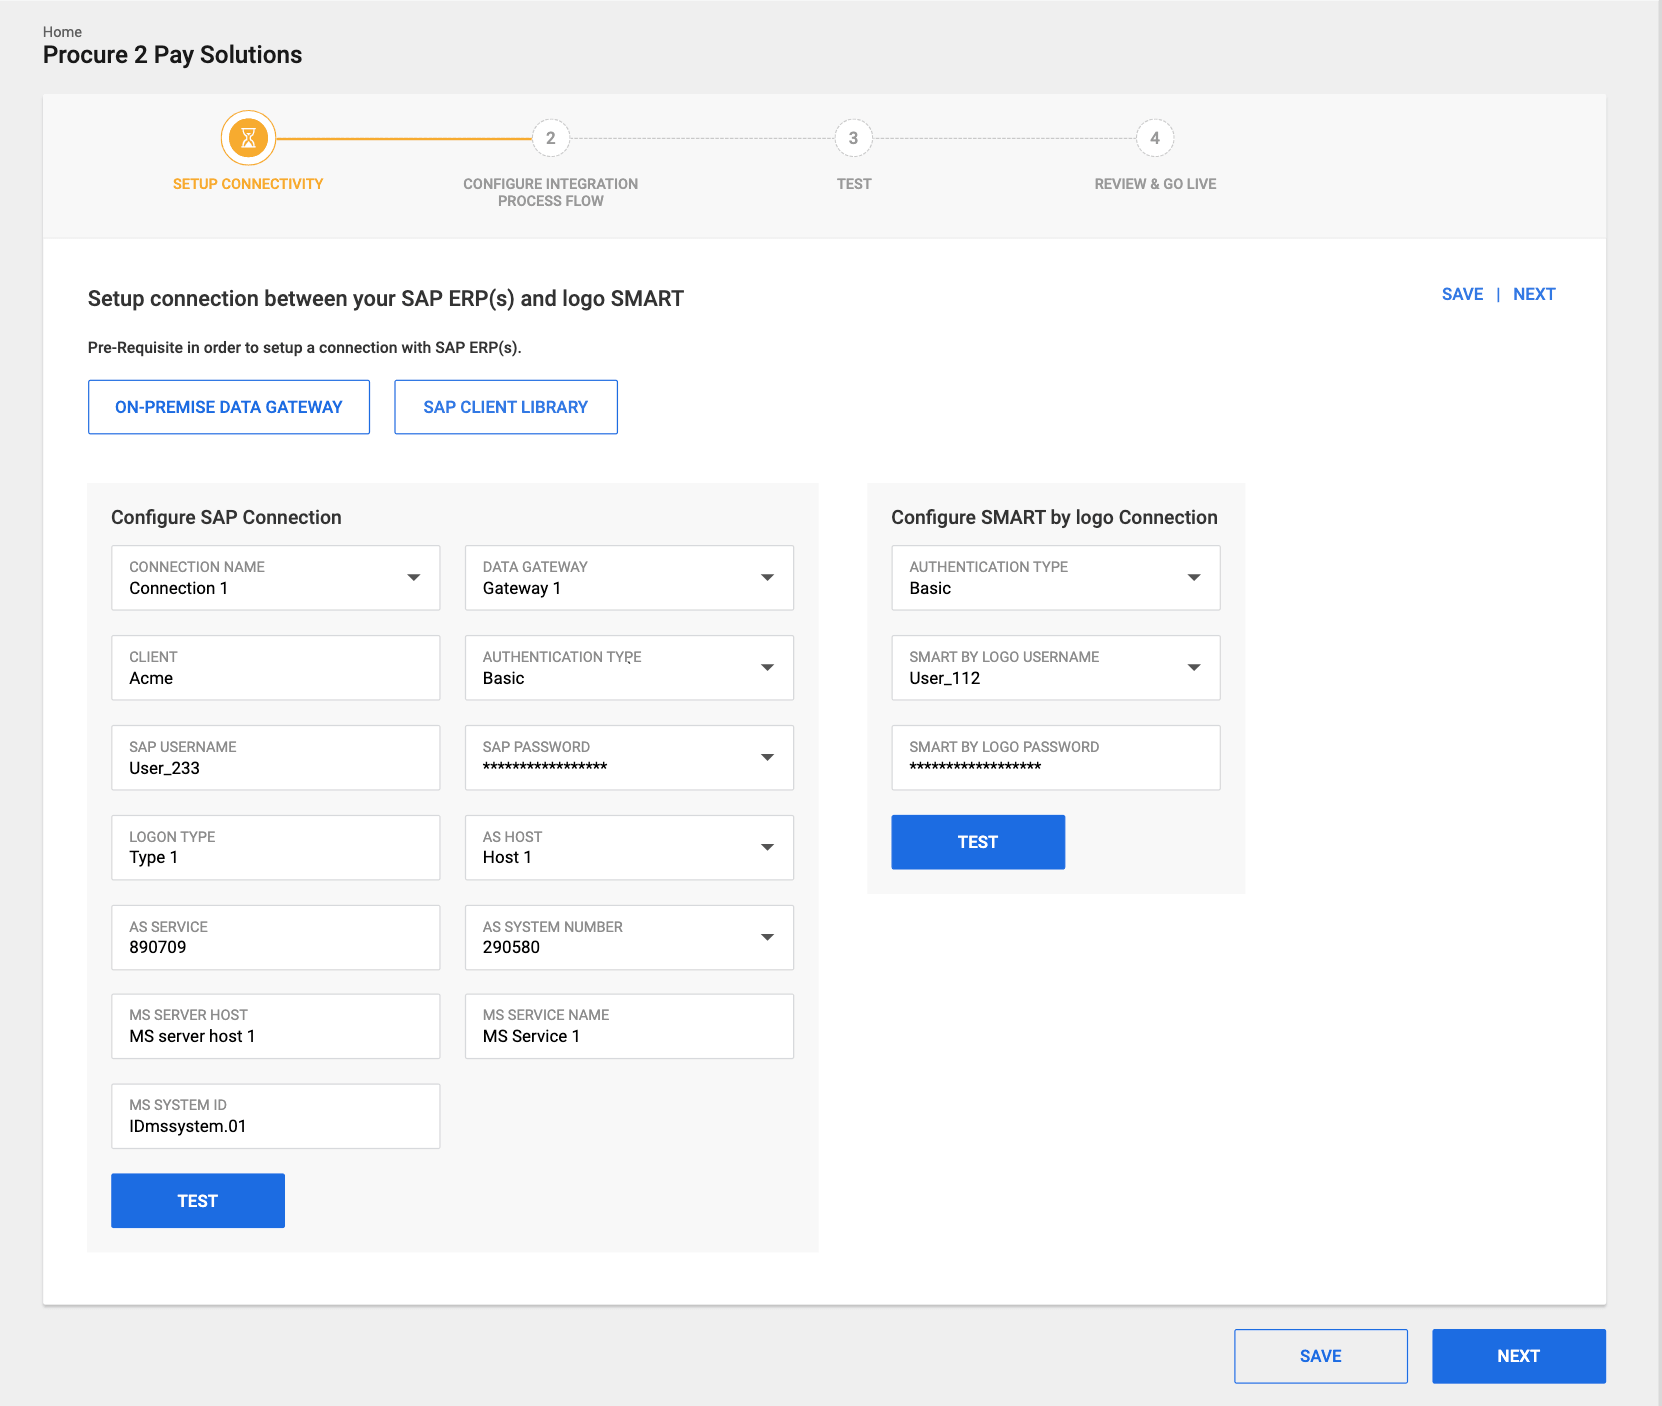
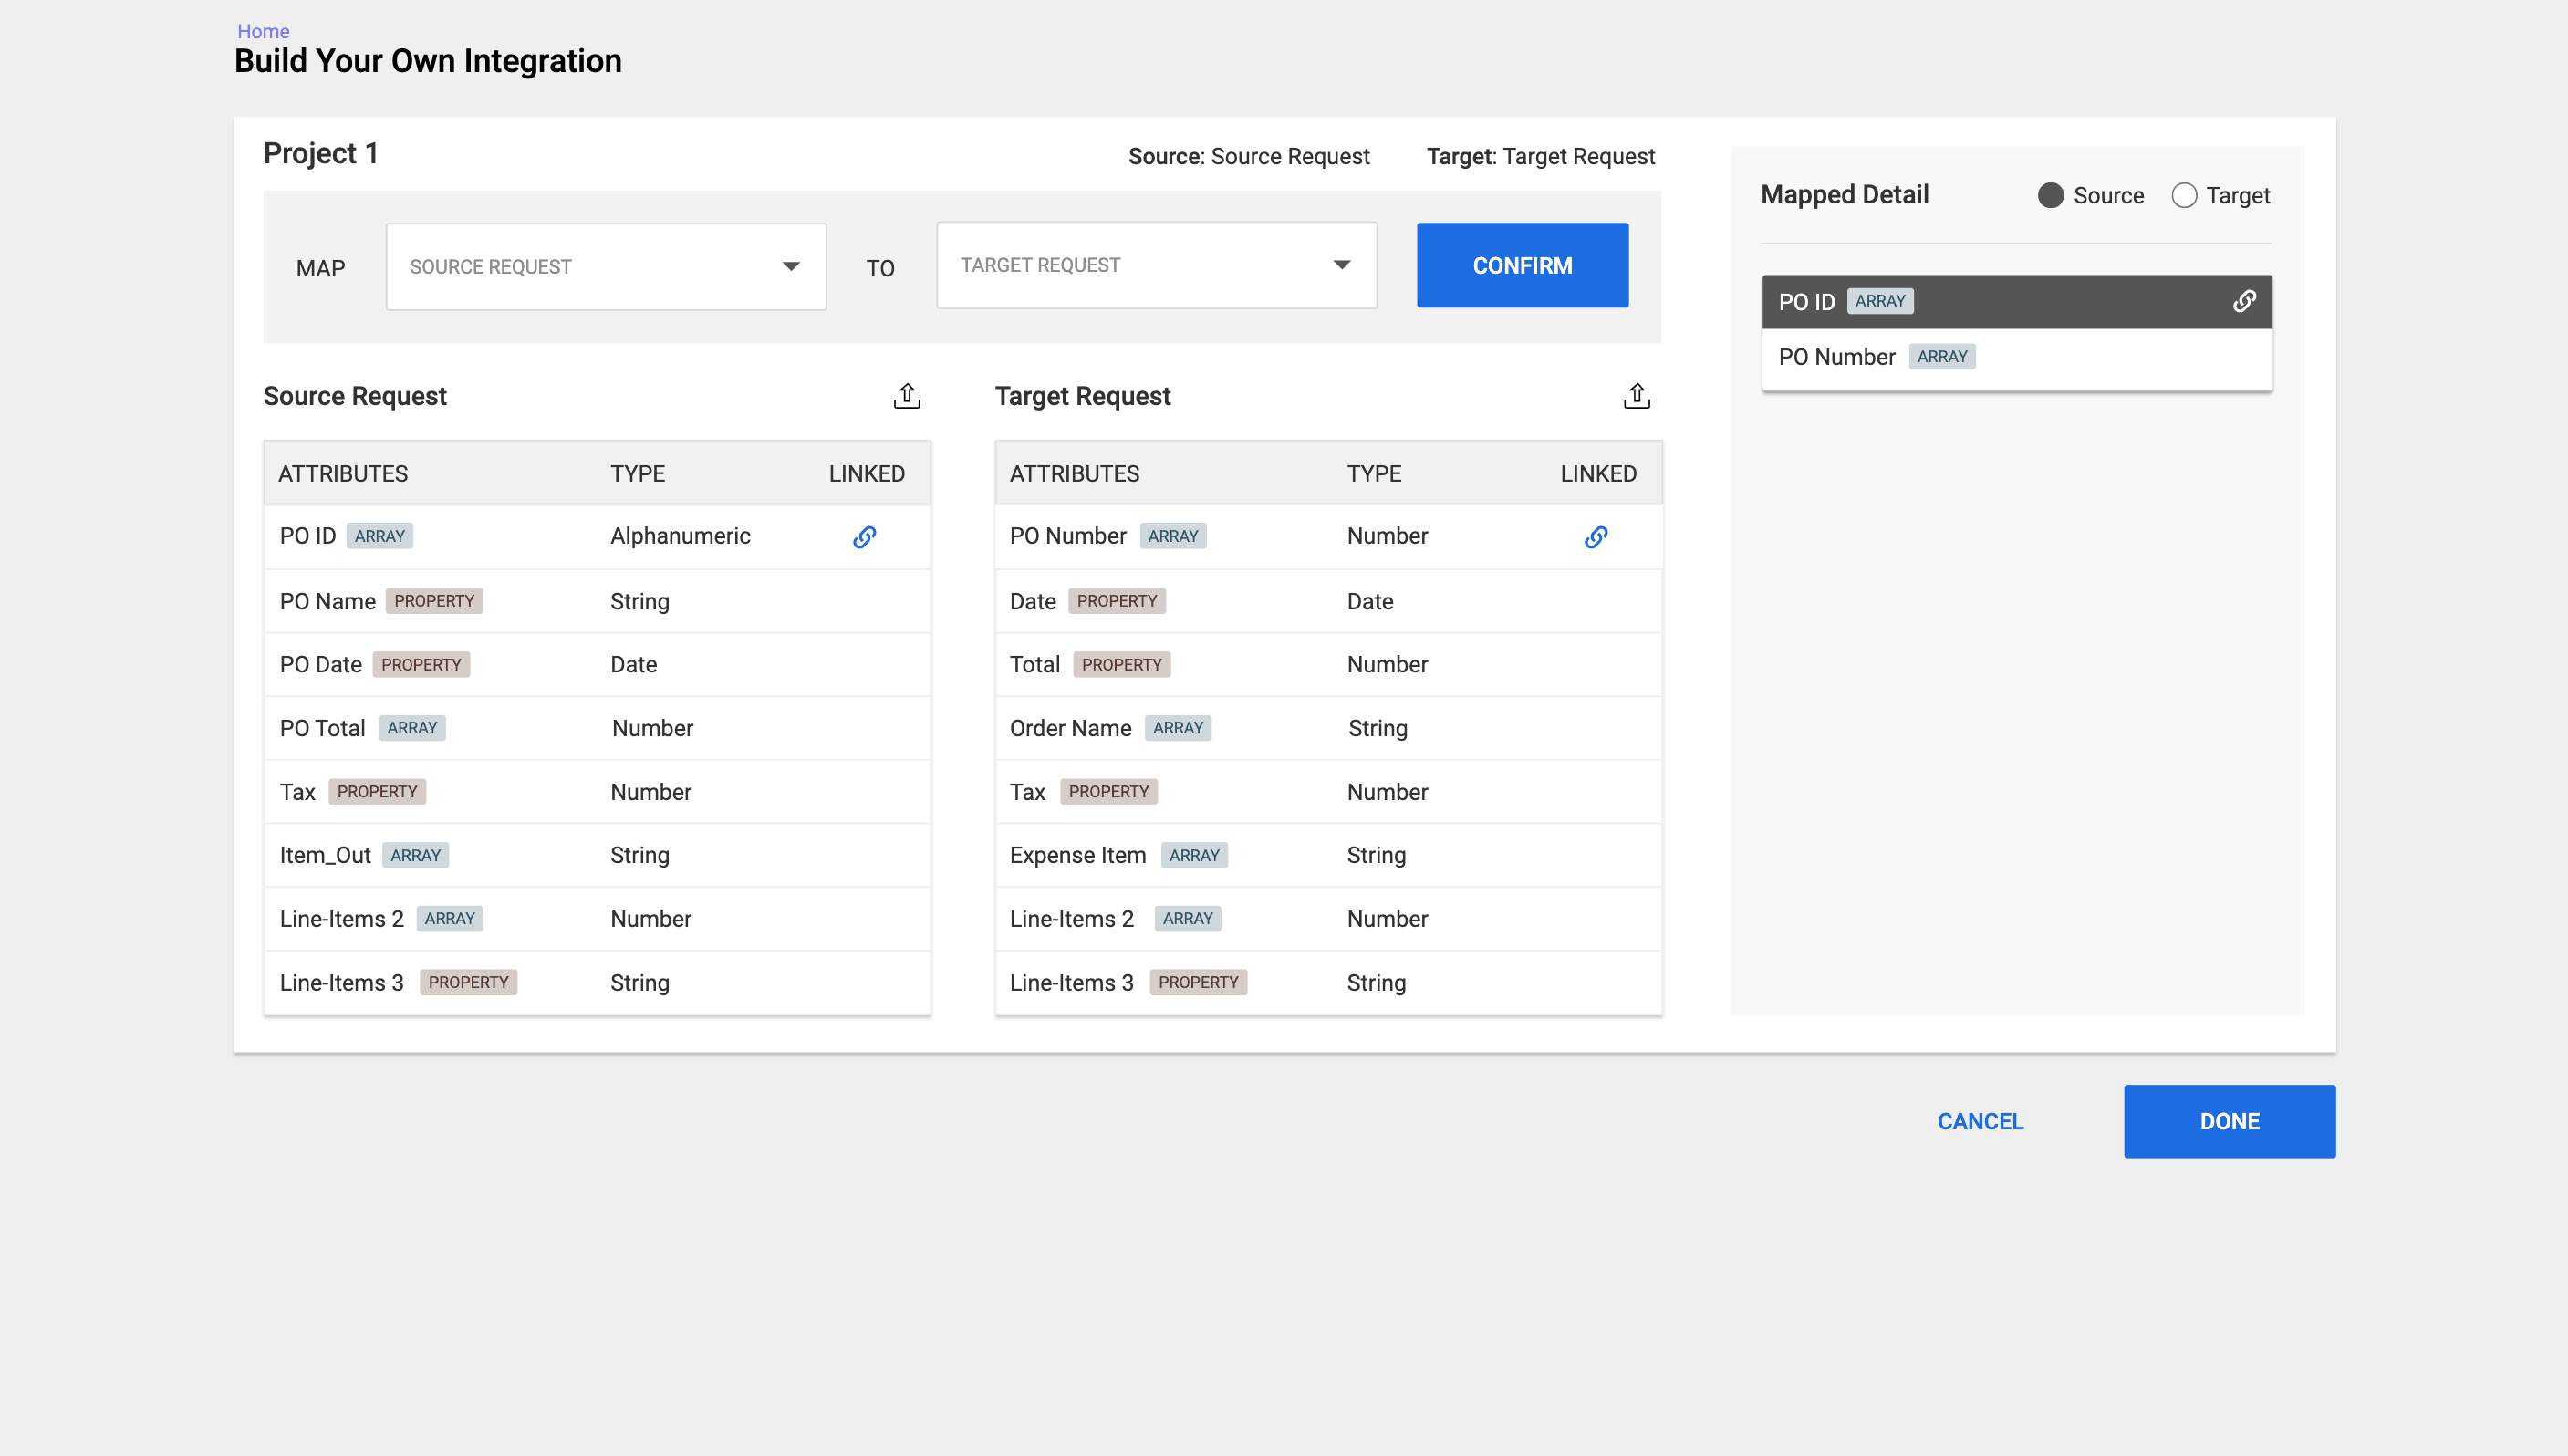
- Designed a clean and intuitive 4-step guided wizard (Setup Connectivity → Configure Integration Process Flow → Test → Review & Go Live) that transforms a highly complex integration process into a structured, achievable experience.
- Incorporated pre-built integration templates, smart defaults, real-time validation, and visual data sync mapping to simplify configuration for both technical and business users.
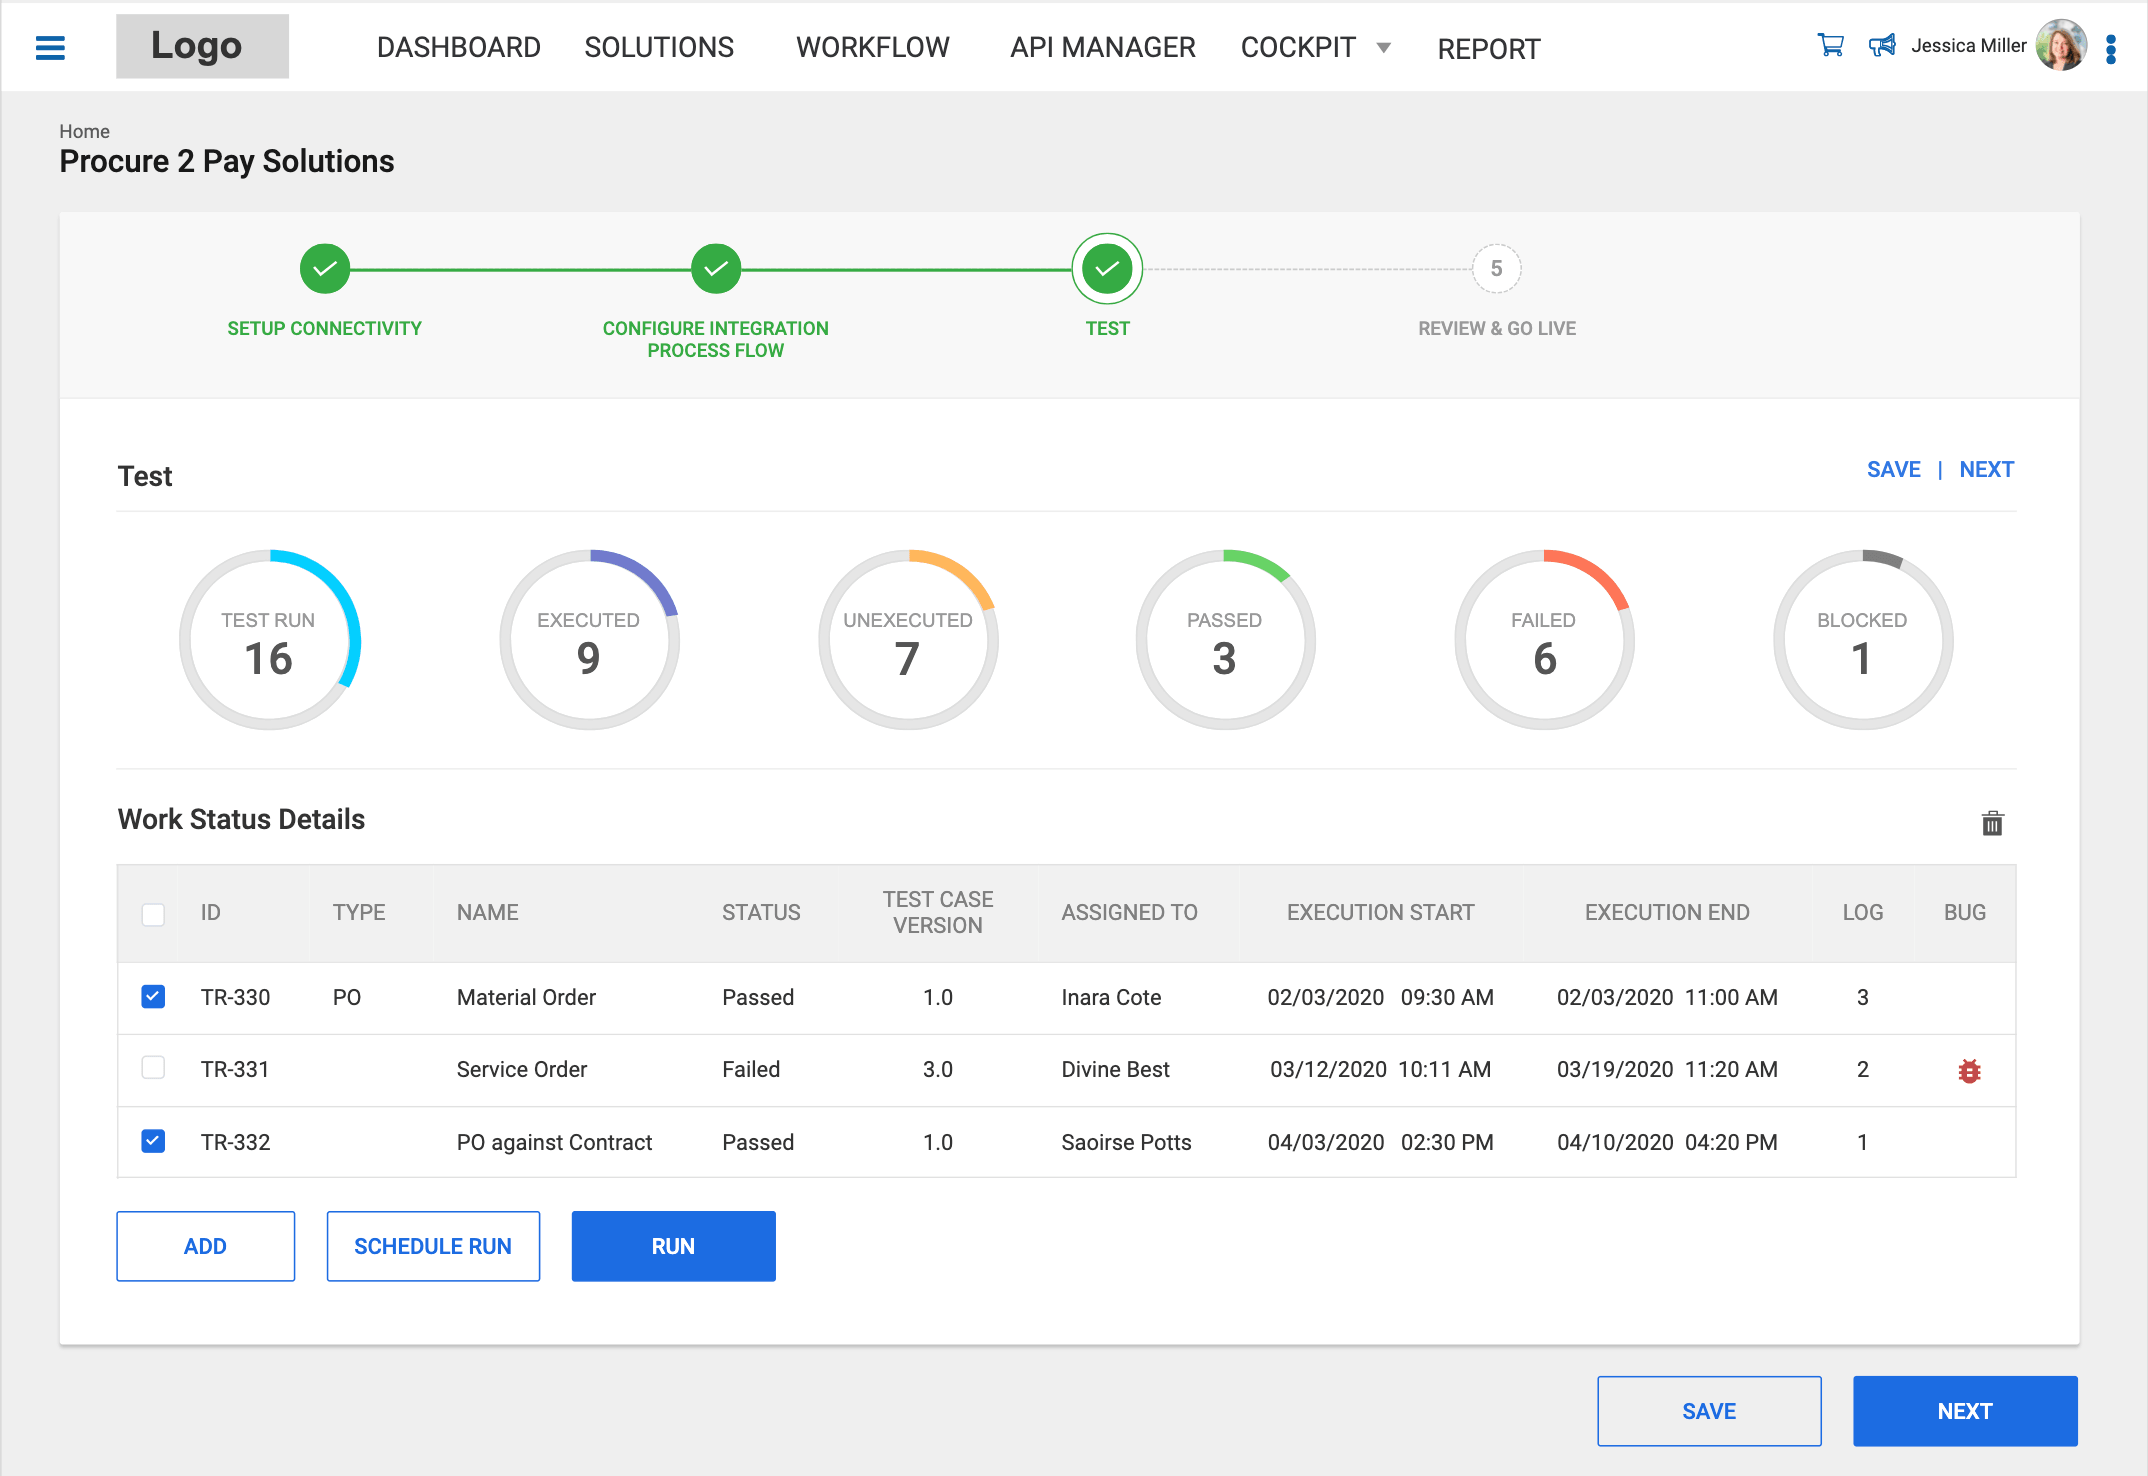
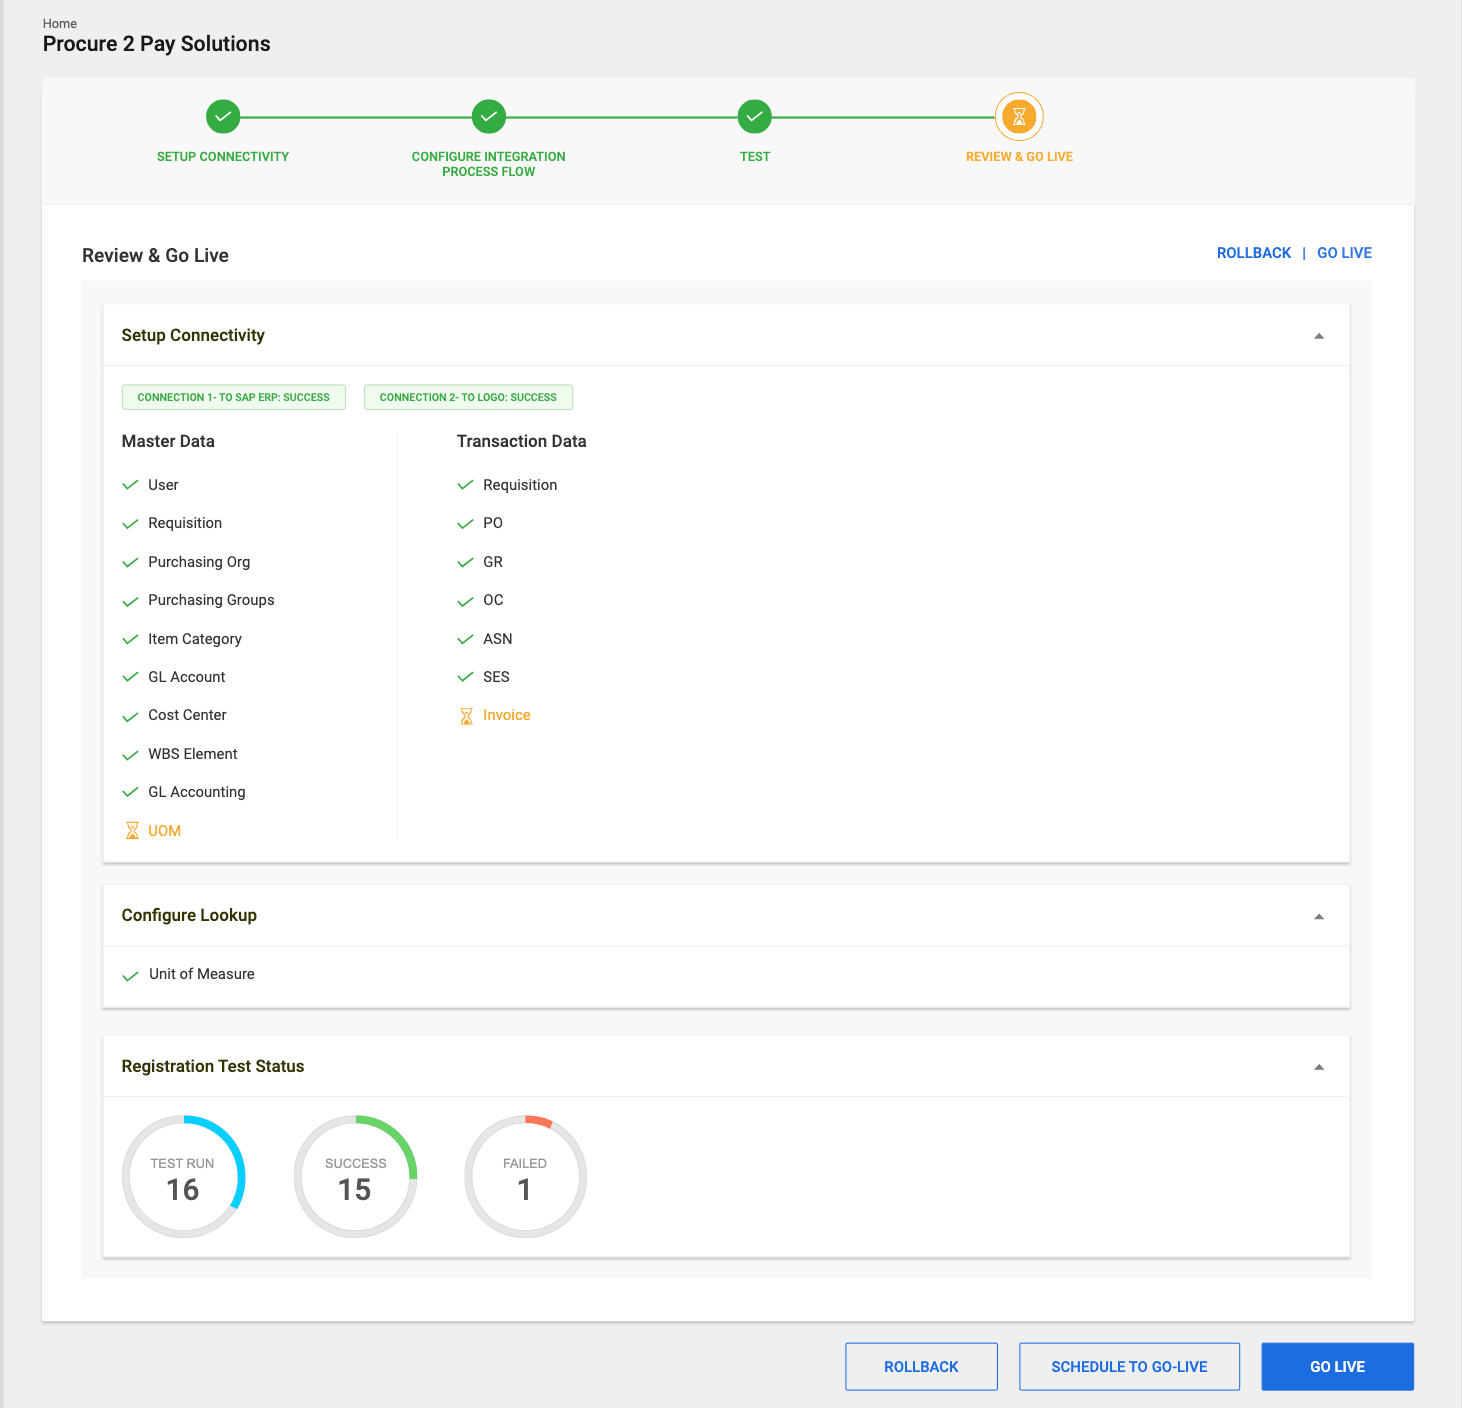
- Created comprehensive test case management with clear status indicators, along with a detailed summary page featuring one-click Go Live functionality.
- Focused on delivering helpful inline guidance, prominent success/error feedback, and easy rollback options to minimize user anxiety and build confidence throughout the journey.
Design Evolution & Final Mockups
Step-by-step evolution showing how concepts developed into final designs.
Results & Impact
The redesigned dashboard led to 65% faster issue detection, a 50% reduction in MTTR, and a 35% increase in deployment success rate. Engineers reported feeling "much more in control" during on-call shifts, with higher confidence in trends and fewer tool switches.
The prototype was highly praised by internal stakeholders and successfully used in client demos.
Reduced perceived complexity of integration from a multi-week technical project to a guided, days-long process.
Received positive feedback on usability from both technical and business users during review sessions.
Established a scalable design system for future integration connectors (Workday, Oracle, etc.).
Accelerated sales conversations by giving prospects a tangible, clickable experience of how the platform works.